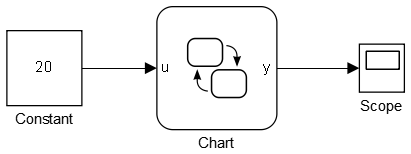
Consider the following simulink model,
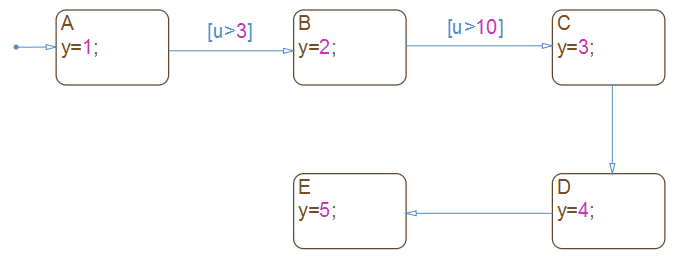
the chart is very simple as shown below.
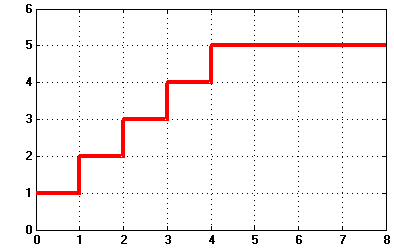
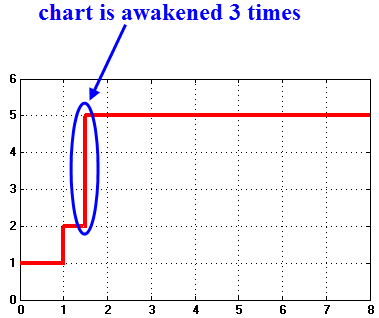
Now, if you run the simulation with a solver w/ variable-step and set the Max step size to be 1, your chart will be awakened at 0s, 1s, 2s, 3s, 4s, 5s, as is evidence by the chart output y.
Suppose, you would like to add a source, a step, say, somewhere in the simulink model, and set the step time @1.5s,
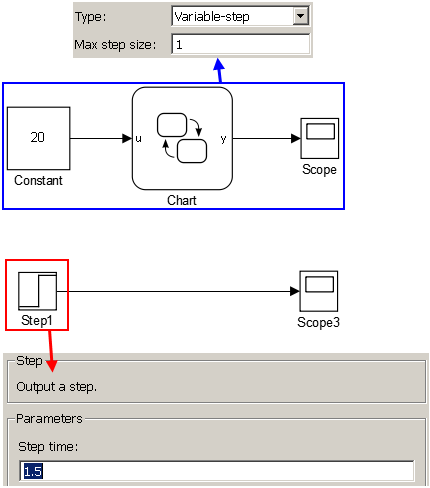
Since 1.5 is not a integer, solver that with variable simulation step will add additional point in its simulation time list (shown below):
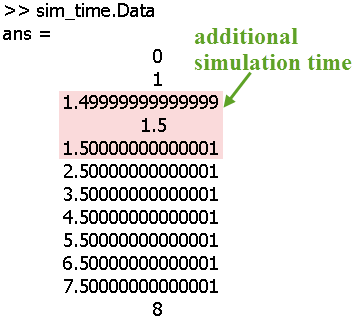
As can be seen, when the step block is added into the Simulink model, the solver will simulate at 3 more instants (1.4999,1.5,1.50001), so the stateflow chart will have a totally different response in that case.
No comments:
Post a Comment