
Showing posts with label stateflow. Show all posts
Showing posts with label stateflow. Show all posts
Monday, December 14, 2015
Flow Chart In Stateflow
A flow chart is a graphical construct that models logic patterns by using connective junctions and transitions, e.g.:


Saturday, December 12, 2015
Enable C-bit Operations
In C action language chart, when Enable C-bit Operations option is checked, 2^11 = 9, whereas when this options is unchecked, the result will be 2^11=2048.


Tuesday, December 8, 2015


Saturday, December 5, 2015
Execution Of Stateflow Chart
By default, Stateflow charts execute once for each active input event. If no input events exist, the charts execute once every time step. That means were you to use a solver with variable step, the charts may get executed at time step not evenly distributed.
Consider the following simulink model,
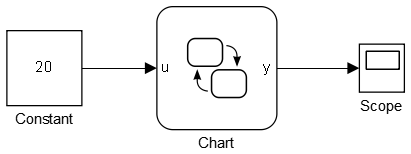
the chart is very simple as shown below.
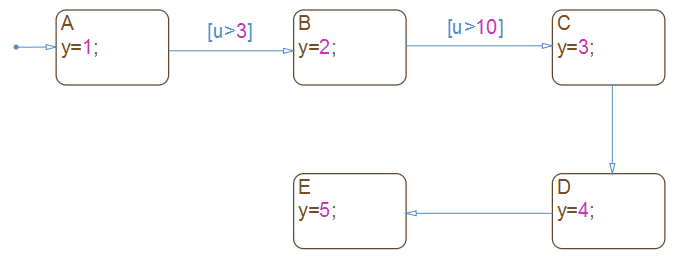
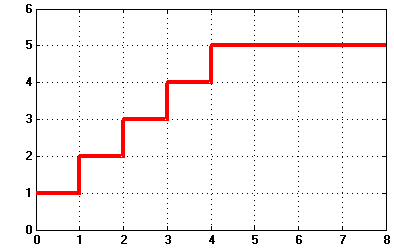
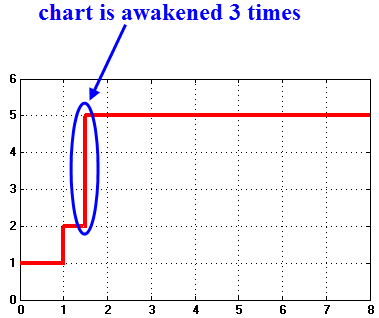
Now, if you run the simulation with a solver w/ variable-step and set the Max step size to be 1, your chart will be awakened at 0s, 1s, 2s, 3s, 4s, 5s, as is evidence by the chart output y.
Suppose, you would like to add a source, a step, say, somewhere in the simulink model, and set the step time @1.5s,
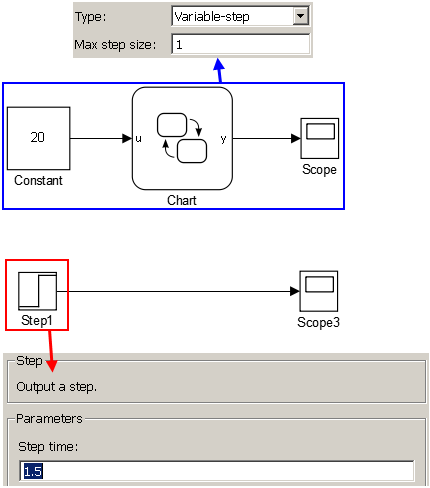
Since 1.5 is not a integer, solver that with variable simulation step will add additional point in its simulation time list (shown below):
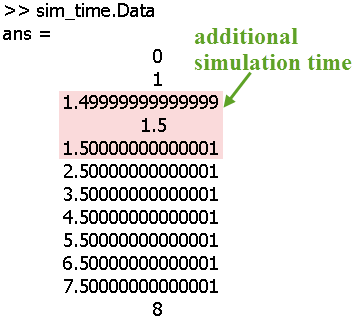
As can be seen, when the step block is added into the Simulink model, the solver will simulate at 3 more instants (1.4999,1.5,1.50001), so the stateflow chart will have a totally different response in that case.
Consider the following simulink model,
the chart is very simple as shown below.
Now, if you run the simulation with a solver w/ variable-step and set the Max step size to be 1, your chart will be awakened at 0s, 1s, 2s, 3s, 4s, 5s, as is evidence by the chart output y.
Suppose, you would like to add a source, a step, say, somewhere in the simulink model, and set the step time @1.5s,
Since 1.5 is not a integer, solver that with variable simulation step will add additional point in its simulation time list (shown below):
As can be seen, when the step block is added into the Simulink model, the solver will simulate at 3 more instants (1.4999,1.5,1.50001), so the stateflow chart will have a totally different response in that case.
Friday, December 4, 2015
Inactive Chart & Active Chart
Inactive Chart:
Active Chart:
- Chart has no active states
- When a Simulink model first triggers a Stateflow chart, the chart is inactive;
Active Chart:
- Chart has active states
- After the chart has been triggered the first time by a Simulink model, it is an active chart.
Thursday, December 3, 2015
Check State Activity (Stateflow)
Use the in operator to check if a state is active, can be used in state actions and transitions.
Syntax
in(S)
where S is a fully qualified state name
The in operator is true and returns a value of 1 whenever state S is active; otherwise, it returns a value of 0.
The in operator is true and returns a value of 1 whenever state S is active; otherwise, it returns a value of 0.


Saturday, November 28, 2015

Friday, November 27, 2015


Wednesday, November 25, 2015
Using Multiple Events in A Chart

Tuesday, November 17, 2015
Switch Between Implicit Ordering And Explicit Ordering
Right-click inside the top level of the chart and select Properties:


In implicit ordering mode, a Stateflow chart orders parallel states implicitly based on location. Priority goes from top to bottom and then left to right


In implicit ordering mode, a Stateflow chart orders parallel states implicitly based on location. Priority goes from top to bottom and then left to right
Sunday, November 15, 2015
Specify Chart's Decomposition
You specify whether a superstate contains parallel (AND) states or exclusive (OR) states by setting its decomposition. A state whose substates are all active when it is active has parallel (AND) decomposition. A state in which only one substate is active when it is active has exclusive (OR) decomposition. An empty state's decomposition is exclusive.
To alter a state's decomposition, select the state, right-click to display the state's Decomposition context menu, and select OR (Exclusive) or AND (Parallel) from the menu.
You can also specify the state decomposition of a chart. In this case, the Stateflow chart treats its top-level states as substates. The chart creates states with exclusive decomposition. To specify a chart's decomposition, deselect any selected objects, right-click to display the chart's Decomposition context menu, and select OR (Exclusive) or AND (Parallel) from the menu.

The appearance of a superstate's substates indicates the superstate's decomposition. Exclusive substates have solid borders, parallel substates, dashed borders.
A parallel substate also contains a number in its upper right corner. The number indicates the activation order of the substate relative to its sibling substates.
Saturday, November 14, 2015

Friday, October 30, 2015
Transition Label Syntax in Stateflow
The action types follow the label notation with this general format:
event_or_message trigger[condition]{condition_action}/{transition_action}
event_or_message trigger[condition]{condition_action}/{transition_action}
Default Action Types for a State
If you do not specify the action type explicitly for a statement, the chart treats that statement as an entry action.

In fact, Matlab uses a mechanism called Action Language Auto Correction that automatically correct some syntax in state transition diagrams

In fact, Matlab uses a mechanism called Action Language Auto Correction that automatically correct some syntax in state transition diagrams
Thursday, October 29, 2015
Add Trigger Port to Stateflow Chart
In Stateflow Editor:
Chart -> Add Inputs & Outputs -> Event Input From Simulink

then in the popup dialog:
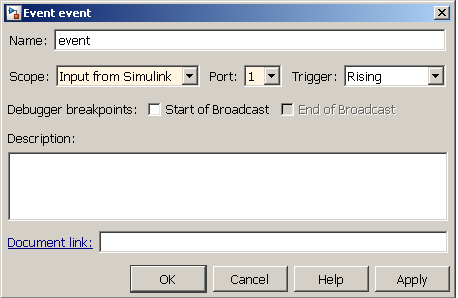
After adding the Trigger Port, the stateflow chart will look like

Chart -> Add Inputs & Outputs -> Event Input From Simulink
then in the popup dialog:
After adding the Trigger Port, the stateflow chart will look like

Subscribe to:
Posts (Atom)